
 Azzam Bilal Chamdy
 Neng Nana
 Nana Muazin
 Dwi Wanna
 Raul Delapena Setiawan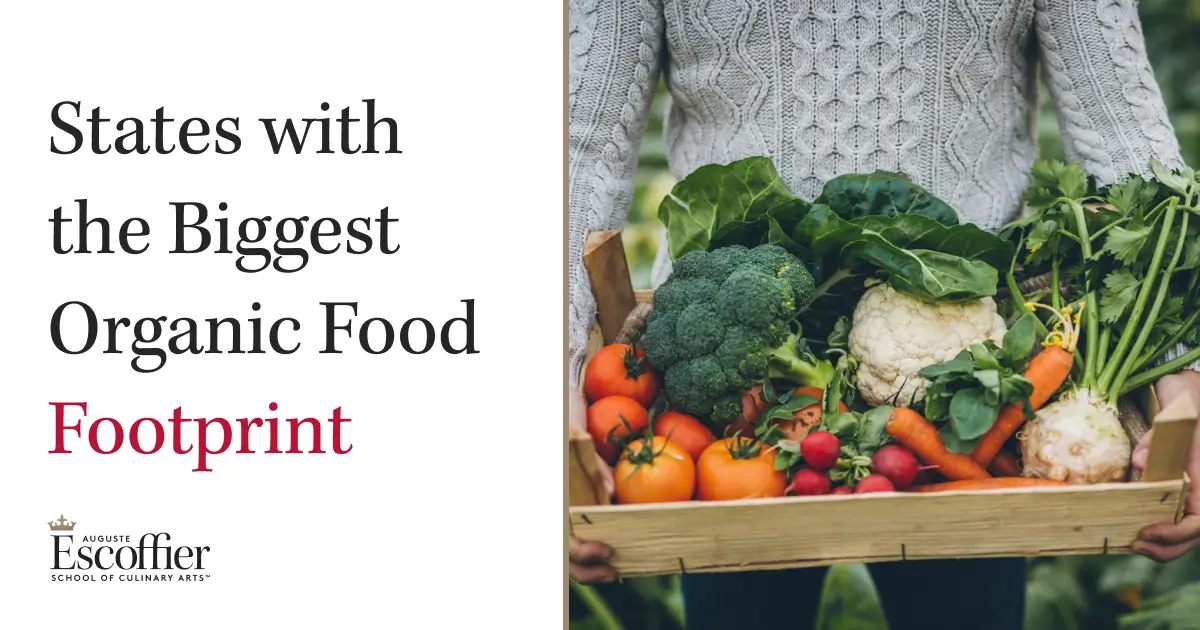
When we discuss the "organic food movement" in the United States, the conversation almost reflexively turns to California. With its sun-drenched valleys and massive agricultural output, the Golden State is the undisputed titan of organic production, accounting for roughly 32% of the nation’s total organic sales. However, a new analytical framework—the "Organic Footprint Intensity Score"—suggests that total sales volume is a misleading metric for understanding how deeply organic farming has actually taken root in the American landscape.
By moving beyond simple revenue figures and analyzing the integration of organic practices into state land and economies, a different picture emerges. This report examines which states have truly woven organic agriculture into their local identity, revealing that while California is the industry’s powerhouse, Vermont is its beating heart.
Main Facts: Redefining Organic Dominance
To move past the dominance of raw sales data, researchers developed an intensity score that weighted three critical metrics based on the USDA’s 2021 Certified Organic Survey:
- The percentage of total state farmland that is certified organic (50% weight).
- Organic acres as a share of total state land (30% weight).
- Organic production value per organic acre (20% weight).
The findings are stark. Vermont, a state that generates only $153 million in organic sales compared to California’s $3.55 billion, dominates the intensity ranking with a score of 81.07—more than three times the score of second-place Pennsylvania (25.04).
The data reveals two distinct paths to a high ranking. The first, exemplified by Vermont, is characterized by high land-use integration, where organic farming isn’t just a niche, but a foundational element of the state’s rural geography. The second path, seen in states like Georgia and North Carolina, focuses on "high-value intensity," where smaller organic footprints generate massive revenue through concentrated production of high-value crops like blueberries, eggs, and specialty produce.
Chronology: The Evolution of Organic Data
The organic movement in the U.S. has transitioned from a fringe agricultural practice to a multi-billion-dollar industrial pillar. In the late 20th century, organic farming was largely localized and unquantified. It wasn’t until the implementation of the USDA’s National Organic Program (NOP) in the early 2000s that consistent certification standards were applied nationwide.
The most recent comprehensive data, released in late 2022 by the USDA, provides the first granular look at the post-pandemic landscape of organic agriculture. Prior to this, data collection was often fragmented. The 2021 survey marked a significant milestone, as it allowed for the comparison of regional shifts in how organic acres are utilized. While the trend for decades was toward massive industrial organic scale in the West, the data now shows a localized "back-to-the-land" resurgence in the Northeast and parts of the South, as consumer demand for local food systems drives farmers to convert smaller plots into high-value organic operations.
Supporting Data: The Tale of Two States
The discrepancy between Vermont and California serves as the perfect case study for the difference between "scale" and "intensity."
| Metric | Vermont | California | Ratio |
|---|---|---|---|
| % Farmland Organic | 16.92% | 3.35% | Vermont 5.0x higher |
| % State Land Organic | 3.30% | 0.78% | Vermont 4.2x higher |
| Farms per 100K People | 107 | 7.8 | Vermont 13.7x higher |
| Total Organic Sales | $153M | $3.55B | California 23x higher |
While California maintains a massive operation—cultivating over 813,000 organic acres—Vermont’s organic identity is woven into its social fabric. With 107 certified organic farms per 100,000 residents, Vermont’s organic sector is highly visible and deeply connected to local consumers.
Conversely, states like Georgia lead in "Sales per Acre," netting $11,799 per acre compared to the national average. This is not because they have the most organic land, but because they have perfected the art of high-value yield. Georgia’s organic economy thrives on niche products like organic poultry and specialty onions, demonstrating that a "large footprint" isn’t required to exert a massive economic influence.
Official Perspectives and Regional Realities
Agricultural economists note that the divergence in these rankings is largely dictated by climate, infrastructure, and historical land use.
"Farmers are not simply picking crops based on trends," says an industry analyst. "They are constrained by soil composition, water availability, and proximity to processing facilities. You cannot force a large-scale organic grain operation into the rolling hills of Vermont any more than you can easily replicate the specialized fruit-growing infrastructure of Washington in the plains of North Dakota."
The regional divide is clear:
- The West Coast: Leverages large-scale infrastructure and ideal climates for high-value fruits and nuts, dominating the total sales volume.
- The Northeast: Pennsylvania and Vermont lead in integration, utilizing organic farming to bolster local food systems and preserve smaller, family-owned plots.
- The South: Georgia and North Carolina excel in efficiency, extracting high value from smaller, specialized organic footprints.
At the bottom of the list, states like Alabama, Mississippi, and Oklahoma show organic footprints below 1% of their total farmland. These regions remain heavily reliant on conventional, large-scale industrial row-cropping, where the transition to organic certification remains a significant logistical and financial hurdle.
Implications: The Future of the Organic Landscape
What do these rankings mean for the future of American agriculture? The data suggests that the "organic footprint" is becoming a proxy for a state’s agricultural resilience. States that have integrated organic farming into their broader land base—like Vermont, New York, and Pennsylvania—are often better positioned to withstand supply chain disruptions because their production is decentralized and directly tied to local markets.
However, the "high-value" path taken by states like Georgia and Washington demonstrates that organic agriculture can also be a driver of high-margin economic growth. By focusing on specific, high-demand products, these states prove that you don’t need to dedicate half your land to organic farming to make it a dominant feature of your agricultural revenue.
For policymakers, the takeaway is clear: support for organic agriculture cannot be "one-size-fits-all." In states with high organic intensity, the focus should be on land preservation and support for small-to-mid-sized family farms. In states with high sales intensity, the focus should be on infrastructure, technology, and market access for high-value crops.
As the organic market continues to mature, the definition of an "organic state" will continue to evolve. Whether through the expansive, industrial-scale organic farms of the West or the dense, community-connected plots of the Northeast, the organic footprint of the United States is no longer a monolith. It is a complex, regionalized, and increasingly sophisticated tapestry of land use that reflects the varied economic and environmental priorities of the American farmer.
Methodology Notes
The Organic Footprint Intensity Score was derived from a weighted normalization of three factors:
- Certified Organic Farmland % (50%): Measures the degree of conversion within the existing agricultural sector.
- Organic Acres to Total Land % (30%): Measures the footprint relative to the state’s total physical geography.
- Sales per Organic Acre (20%): Measures the economic output intensity of the land.
The analysis included 48 states, excluding Alaska and Delaware due to withheld sales data. All figures are based on the 2021 USDA Certified Organic Survey, adjusted against U.S. Census Bureau population and land mass data. This report strictly tracks certified organic production, not organic consumption, meaning these figures reflect what is grown within state lines, not necessarily what is consumed by the residents of those states.


 Evan Lee Salim